Electrolux · Research ops

Making research impact visible

Tracking how 10+ studies shaped product and design decisions.

Overview

Research shaped decisions, and the evidence lived in chats, roadmaps, and memory. Quarterly reports counted studies, so research influence was invisible. I built a way to trace each study to the decisions it shaped.

After a study readout, findings fade without tracking; with follow-up, a weekly log, tagging by horizon, and a quarterly report, impact is recorded from signal to outcome
Role
Lead UX Researcher, Research Operations
Timeline
2025–present
Teams
Product Management, Design, Engineering, Research leadership

Context

The process had to fit a researcher’s week and hold up across long hardware cycles.

Constraints

  • TimeHad to fit into a weekly routine.
  • Long cyclesHardware outcomes can arrive months after a study.
  • AccessProduct and business data is scattered across teams and tools.

Why map impact?

Research pays off when a team acts on it, often weeks later and out of sight. Mapping links each study to the decisions it shaped.

  • Proves valueShows the return on research when budgets tighten.
  • Captures invisible winsFeatures cut, risks avoided, new ways of working.
  • Brings research upstreamTeams that see research shape decisions involve it from the start.

How I approached it

I adapted an industry framework for a hardware org with three changes:

Inspired by Nikki Anderson, The User Research Strategist.

  1. Name the decision up frontEach study brief states the decision it informs or influences.
  2. Log early impactTrack signals and decisions as leading indicators.
  3. Keep time and effort lowTen minutes a week to log, one follow-up at 4–6 weeks, and a one-page report each quarter.

In practice

Four steps to record impact after each study.

1

Send a follow-up

4–6 weeks after each study, to the PM, design, and engineering leads

  1. What changed after the study?
  2. Which metric are you tracking?
  3. Who else should I contact?
  4. Can I share your quote?

2

Update the log

Every Friday · 10 min

  1. PlanSet the decision, metric, and baseline at kickoff.
  2. SignalsRecord who attended and where findings were cited.
  3. Impact logRecord who used the research, what they did, and what changed.
  4. ConfirmationAsk stakeholders to confirm what changed and why.

3

Tag each entry by horizon

From early signals to measured outcomes

    4

    Build the report from the log

    Confirmed entries, grouped by horizon

    • Add a quarter summary and next-quarter focus areas.
    • Share quotes only with permission.

    ↻ Repeat for each study

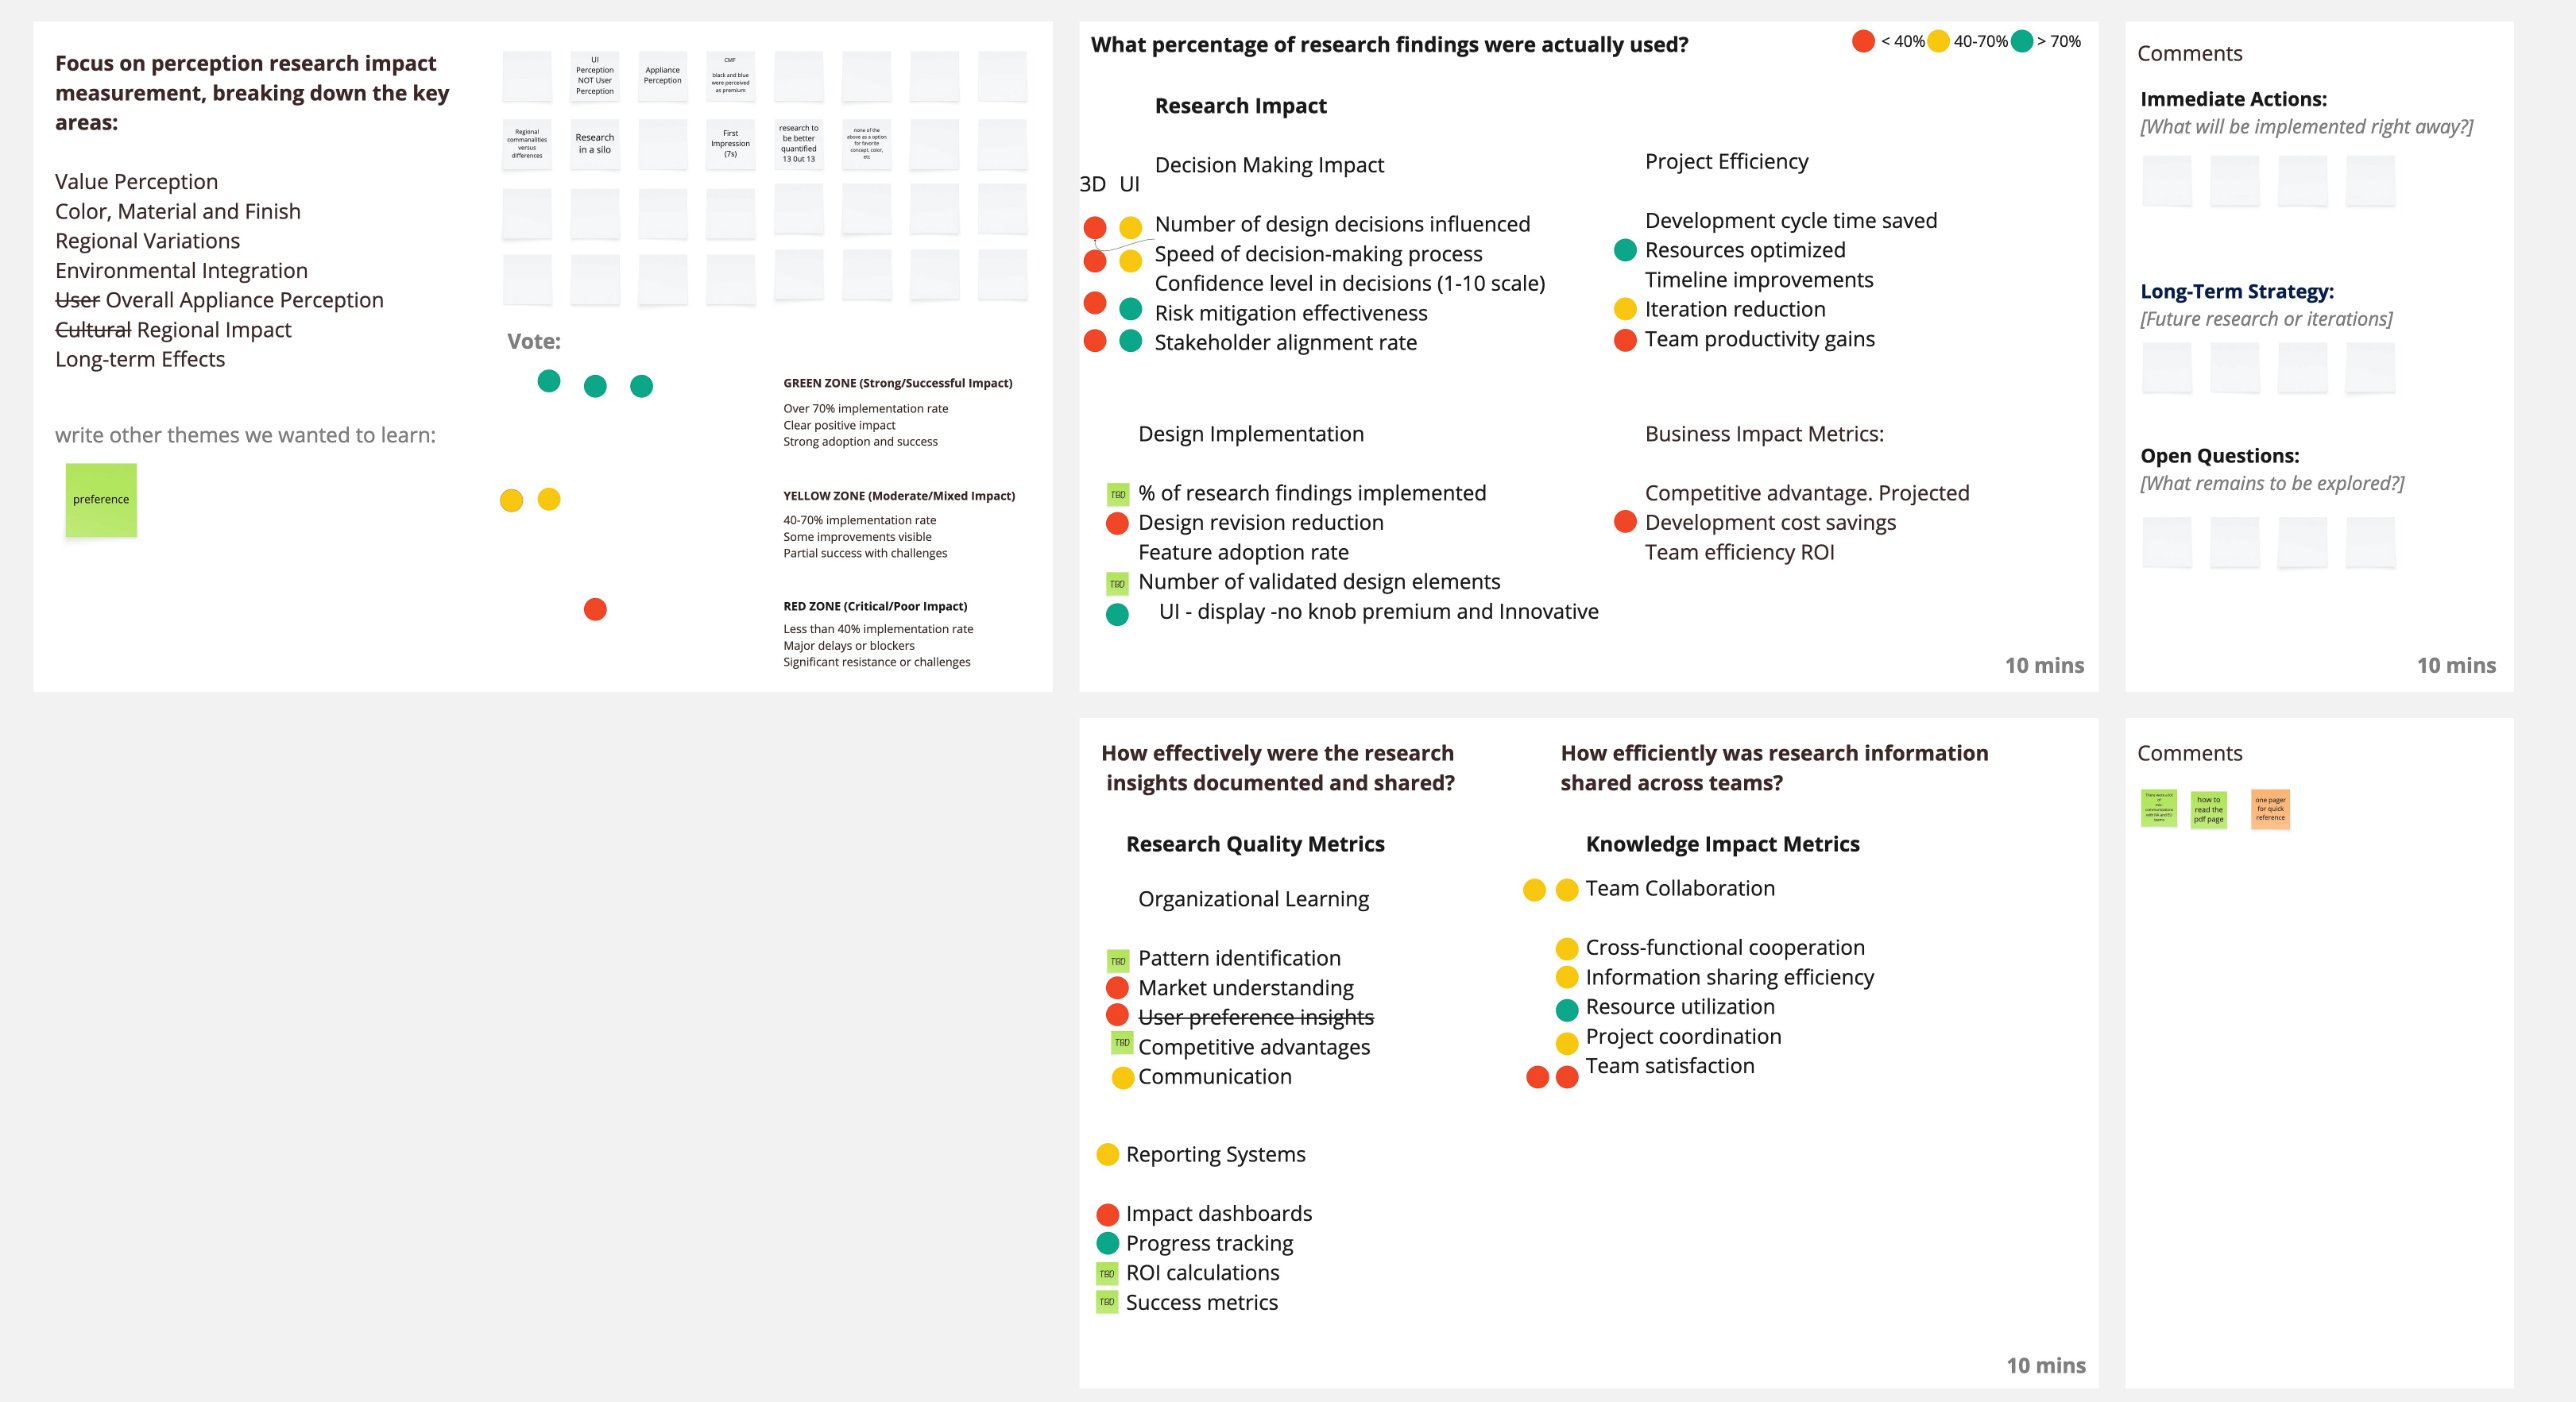
    Impact review on Miro: rating decisions, implementation, and efficiency, then prioritizing what to track.

    Miro board from an impact review after a perception study: themes, votes, and color-coded ratings of how findings were usedPMIndustrial designerDesign researcherInteraction designerDesign manager
    After a perception study, the team rated how much of the research they used.

    Impact horizons

    Each log entry gets one horizon.

    Signal

    Teams are engaging with the research

    Evidence
    Sessions joined. Stakeholders attended sessions, readouts, or field visits
    Findings quoted. Findings appear in decks, specs, roadmaps, or leadership updates
    When it shows up
    During the study and in the first weeks after

    Decision

    The research informed a decision

    Evidence
    Decision confirmed. A stakeholder confirms the study informed a specific decision
    Risk avoided. A feature, launch, or investment was changed, paused, or stopped
    When it shows up
    Within weeks to a few months

    Change

    A product or process changed

    Evidence
    Product change. A feature, flow, hardware, or content change
    Ways of working. A team adopted new criteria, rituals, or methods
    When it shows up
    Within one to two quarters

    Outcome

    A metric moved against the baseline

    Evidence
    Metric moved. The kickoff metric changed, such as satisfaction, task success, returns, or support calls
    Cost or time saved. Rework, support load, or development time decreased
    When it shows up
    After launch, often two or more quarters later

    Impact to date

    Used across 10+ studies at Electrolux North America since 2025.

    • VisibilityStakeholders can trace which decisions research informed.
    • ReportsQuarterly reports show influence + activity.
    • NextExtend to global teams and connect log entries to business metrics.